2. Describing Data with Tables and Graphs
Frequency Distributions
Problem 2.5.32
Textbook Question
Interpreting Percentiles In Exercises 29–32, use the ogive, which represents the cumulative frequency distribution for quantitative reasoning scores on the Graduate Record Examination in a recent range of years. (Adapted from Educational Testing Service)
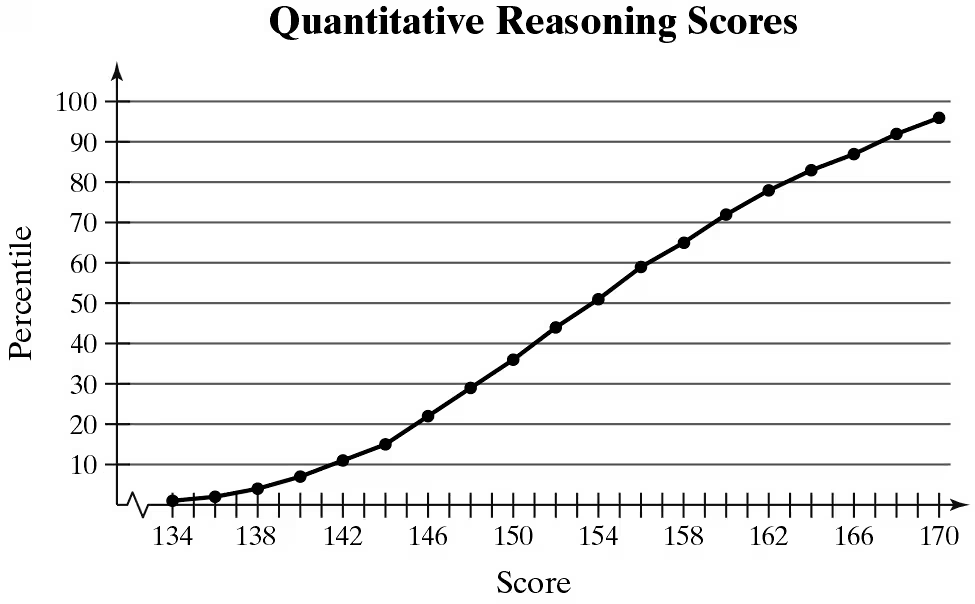
What percentile is a score of 170? How should you interpret this?
 Verified step by step guidance
1
Step 1: Understand the ogive graph. An ogive is a cumulative frequency graph that shows the percentage of data points below a certain value. The x-axis represents the scores, and the y-axis represents the percentiles.
Step 2: Locate the score of 170 on the x-axis of the graph. Draw a vertical line from this point upward until it intersects the curve.
Step 3: From the point of intersection, draw a horizontal line to the y-axis. This will give the corresponding percentile for the score of 170.
Step 4: Interpret the percentile value. The percentile indicates the percentage of test-takers who scored below 170. For example, if the percentile is 95, it means 95% of test-takers scored below 170.
Step 5: Use this information to understand the relative performance. A high percentile (e.g., 95th) suggests that the score of 170 is better than most test-takers, placing the individual in the top 5%.
Verified video answer for a similar problem:This video solution was recommended by our tutors as helpful for the problem above
Video duration:
1mWas this helpful?

 6:38m
6:38mWatch next
Master Intro to Frequency Distributions with a bite sized video explanation from Patrick
Start learningRelated Videos
Related Practice


