2. Describing Data with Tables and Graphs
Frequency Distributions
Problem 2.1.5
Textbook Question
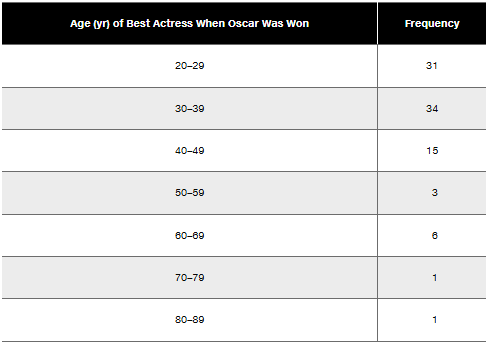
In Exercises 5–8, identify the class width, class midpoints, and class boundaries for the given frequency distribution. Also identify the number of individuals included in the summary. The frequency distributions are based on real data from Appendix B.
 Verified step by step guidance
1
Step 1: Identify the class width. The class width is calculated by subtracting the lower boundary of one class from the lower boundary of the next class. For example, subtract 20 (lower boundary of the first class) from 30 (lower boundary of the second class).
Step 2: Calculate the class midpoints. The class midpoint is the average of the lower and upper boundaries of each class. For example, for the first class (20–29), calculate (20 + 29) / 2.
Step 3: Determine the class boundaries. The class boundaries are the values that separate one class from another without gaps. For example, for the first class (20–29), the lower boundary is 19.5 and the upper boundary is 29.5.
Step 4: Sum the frequencies to find the total number of individuals included in the summary. Add all the frequencies together: 31 + 34 + 15 + 3 + 6 + 1 + 1.
Step 5: Verify the calculations and ensure all values (class width, midpoints, boundaries, and total frequency) are consistent with the data provided in the frequency distribution table.
Verified video answer for a similar problem:This video solution was recommended by our tutors as helpful for the problem above
Video duration:
5mWas this helpful?
Key Concepts
Here are the essential concepts you must grasp in order to answer the question correctly.
Class Width
Class width refers to the range of values that each class interval covers in a frequency distribution. It is calculated by subtracting the lower boundary of a class from its upper boundary. For example, in the age distribution provided, the class width for the age range 20-29 is 10 years (29 - 20 = 9, plus one for inclusive counting).
Recommended video:
Guided course

 05:18
05:18How to Create Frequency Distributions Example 2
Class Midpoint
The class midpoint is the value that lies in the middle of a class interval and is calculated by averaging the upper and lower boundaries of that class. For instance, the midpoint for the age range 20-29 is (20 + 29) / 2 = 24.5. This value is often used in statistical calculations, such as finding the mean of grouped data.
Recommended video:
 04:15
04:15Frequency Polygons Example 1
Class Boundaries
Class boundaries are the values that separate one class from another in a frequency distribution. They are determined by taking the upper limit of one class and the lower limit of the next class, ensuring there are no gaps between classes. For example, the class boundaries for the age range 20-29 would be 19.5 (lower) and 29.5 (upper), allowing for a continuous range of data.
Recommended video:
Guided course
 07:10
07:10How to Create Histogram - TI-84 Calculator
 6:38m
6:38mWatch next
Master Intro to Frequency Distributions with a bite sized video explanation from Patrick
Start learningRelated Videos
Related Practice


