2. Describing Data with Tables and Graphs
Dot Plots
Struggling with Statistics?
Join thousands of students who trust us to help them ace their exams!Watch the first videoMultiple Choice
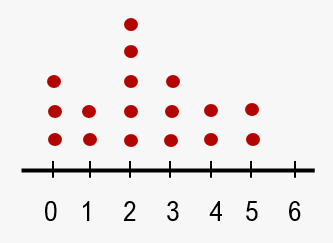
The dotplot below shows the number of books read in a month by students in a college class. Find the most and least frequent number of books read.
A
The most frequent number of books read: 2
The least frequent number of books read: 6
B
The most frequent number of books read: 2
The least frequent number of books read: 1,4,5
C
The most frequent number of books read: 5
The least frequent number of books read: 1,4,5
D
The most frequent number of books read: 5
The least frequent number of books read: 6
E
The most frequent number of books read: 2
The least frequent number of books read: 0
 Verified step by step guidance
1
Step 1: Observe the dotplot provided. Each dot represents the number of students who read a specific number of books in a month. The x-axis shows the number of books read, and the y-axis (represented by the number of dots) shows the frequency of students for each number of books.
Step 2: Count the number of dots above each number on the x-axis to determine the frequency of students for each number of books read. For example, count the dots above 0, 1, 2, 3, 4, 5, and 6.
Step 3: Identify the number of books read with the highest frequency (most dots). This is the most frequent number of books read.
Step 4: Identify the number(s) of books read with the lowest frequency (fewest dots). This is the least frequent number of books read.
Step 5: Compare the frequencies for all numbers of books read and write down the most frequent and least frequent numbers based on your observations.


Related Videos
Related Practice

