6. Normal Distribution and Continuous Random Variables
Probabilities & Z-Scores w/ Graphing Calculator
Problem 6.1.13
Textbook Question
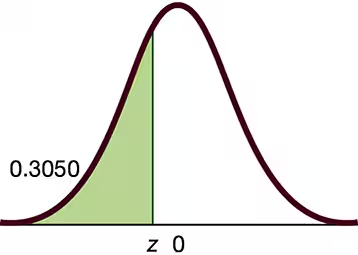
Standard Normal Distribution. In Exercises 13–16, find the indicated z score. The graph depicts the standard normal distribution of bone density scores with mean 0 and standard deviation 1.
 Verified step by step guidance
1
Step 1: Understand the problem. The graph represents a standard normal distribution with a mean of 0 and a standard deviation of 1. The shaded area to the left of the z-score corresponds to a cumulative probability of 0.3050.
Step 2: Recall the relationship between z-scores and cumulative probabilities. The z-score is the value on the horizontal axis of the standard normal distribution that corresponds to a given cumulative probability.
Step 3: Use a standard normal distribution table or a statistical software/tool to find the z-score that corresponds to a cumulative probability of 0.3050. This involves looking up the cumulative probability in the table and identifying the associated z-score.
Step 4: Note that the cumulative probability represents the area under the curve to the left of the z-score. Ensure that the table or tool you use is designed for the standard normal distribution.
Step 5: Verify your result by checking that the cumulative probability for the identified z-score matches 0.3050. This ensures accuracy in your calculation.
Verified video answer for a similar problem:This video solution was recommended by our tutors as helpful for the problem above
Video duration:
1mWas this helpful?
Key Concepts
Here are the essential concepts you must grasp in order to answer the question correctly.
Standard Normal Distribution
The standard normal distribution is a special case of the normal distribution where the mean is 0 and the standard deviation is 1. It is represented by the bell-shaped curve, which is symmetric about the mean. This distribution is crucial for statistical analysis as it allows for the calculation of probabilities and z-scores, which indicate how many standard deviations an element is from the mean.
Recommended video:
Guided course

 09:47
09:47Finding Standard Normal Probabilities using z-Table
Z-Score
A z-score is a statistical measurement that describes a value's relationship to the mean of a group of values. It is calculated by subtracting the mean from the value and then dividing by the standard deviation. Z-scores are essential for understanding how far away a particular score is from the average, allowing for comparisons across different datasets.
Recommended video:
Guided course
 06:31
06:31Z-Scores From Given Probability - TI-84 (CE) Calculator
Area Under the Curve
In the context of the normal distribution, the area under the curve represents the probability of a random variable falling within a particular range. The total area under the curve equals 1, and specific areas correspond to probabilities associated with z-scores. For example, the shaded area in the provided graph indicates the probability of obtaining a z-score less than 0, which is 0.3050.
Recommended video:
Guided course
 08:50
08:50Z-Scores from Probabilities
 7:09m
7:09mWatch next
Master Probability From Given Z-Scores - TI-84 (CE) Calculator with a bite sized video explanation from Patrick
Start learningRelated Videos
Related Practice

