Table of contents
- 1. Intro to Stats and Collecting Data55m
- 2. Describing Data with Tables and Graphs1h 55m
- 3. Describing Data Numerically1h 45m
- 4. Probability2h 16m
- 5. Binomial Distribution & Discrete Random Variables2h 33m
- 6. Normal Distribution and Continuous Random Variables1h 38m
- 7. Sampling Distributions & Confidence Intervals: Mean1h 3m
- 8. Sampling Distributions & Confidence Intervals: Proportion1h 12m
- 9. Hypothesis Testing for One Sample1h 1m
- 10. Hypothesis Testing for Two Samples2h 8m
- 11. Correlation48m
- 12. Regression1h 4m
- 13. Chi-Square Tests & Goodness of Fit1h 20m
- 14. ANOVA1h 0m
6. Normal Distribution and Continuous Random Variables
Standard Normal Distribution
Problem 6.2.38
Textbook Question
Outliers For the purposes of constructing modified boxplots as described in Section 3-3, outliers are defined as data values that are above Q3 by an amount greater than 1.5 x IQR or below Q1 by an amount greater than 1.5 x IQR, where IQR is the interquartile range. Using this definition of outliers, find the probability that when a value is randomly selected from a normal distribution, it is an outlier.
 Verified step by step guidance
1
Step 1: Recall the definition of an outlier. An outlier is a data value that is either greater than Q3 + 1.5 Ă— IQR or less than Q1 - 1.5 Ă— IQR, where Q1 and Q3 are the first and third quartiles, respectively, and IQR (interquartile range) is defined as Q3 - Q1.
Step 2: For a normal distribution, the quartiles Q1 and Q3 correspond to specific z-scores. Q1 corresponds to the 25th percentile, and Q3 corresponds to the 75th percentile. Using a z-score table or standard normal distribution properties, these z-scores are approximately -0.674 and 0.674, respectively.
Step 3: Calculate the IQR in terms of z-scores. Since IQR = Q3 - Q1, substitute the z-scores: IQR = 0.674 - (-0.674) = 1.348.
Step 4: Determine the z-score boundaries for outliers. The boundaries are Q3 + 1.5 Ă— IQR and Q1 - 1.5 Ă— IQR. Substituting the values: Upper boundary = 0.674 + 1.5 Ă— 1.348, and Lower boundary = -0.674 - 1.5 Ă— 1.348.
Step 5: Use the standard normal distribution to find the probability of being outside these boundaries. This involves calculating the cumulative probability for the lower boundary and subtracting it from 1 minus the cumulative probability for the upper boundary. Use a z-score table or statistical software to find these probabilities.
 Verified video answer for a similar problem:
This video solution was recommended by our tutors as helpful for the problem above
Video duration:
6mPlay a video:
Was this helpful?
Key Concepts
Here are the essential concepts you must grasp in order to answer the question correctly.
Outliers
Outliers are data points that significantly differ from other observations in a dataset. In the context of boxplots, they are defined as values that lie beyond the thresholds set by the first quartile (Q1) and the third quartile (Q3), specifically those that are more than 1.5 times the interquartile range (IQR) above Q3 or below Q1. Identifying outliers is crucial for understanding data distribution and ensuring accurate statistical analysis.
Recommended video:
Guided course

Comparing Mean vs. Median
Interquartile Range (IQR)
The interquartile range (IQR) is a measure of statistical dispersion that represents the range within which the central 50% of data points lie. It is calculated as the difference between the third quartile (Q3) and the first quartile (Q1). The IQR is particularly useful for identifying outliers, as it provides a robust measure of variability that is less affected by extreme values compared to the overall range.
Recommended video:
Guided course

Find 5-Number Summary - TI-84 Calculator Example 1
Normal Distribution
A normal distribution is a continuous probability distribution characterized by its bell-shaped curve, where most observations cluster around the mean, and probabilities for values further away from the mean taper off symmetrically. In a normal distribution, approximately 68% of values fall within one standard deviation of the mean, and about 95% fall within two standard deviations. Understanding the properties of normal distribution is essential for calculating probabilities related to outliers.
Recommended video:
Guided course

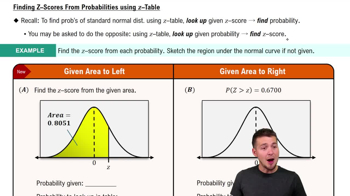
Finding Standard Normal Probabilities using z-Table

 9:47m
9:47mWatch next
Master Finding Standard Normal Probabilities using z-Table with a bite sized video explanation from Patrick
Start learning


