6. Exponential & Logarithmic Functions
Graphing Exponential Functions
Struggling with College Algebra?
Join thousands of students who trust us to help them ace their exams!Watch the first videoMultiple Choice
Graph the given function.
A

B
C
D
 Verified step by step guidance
1
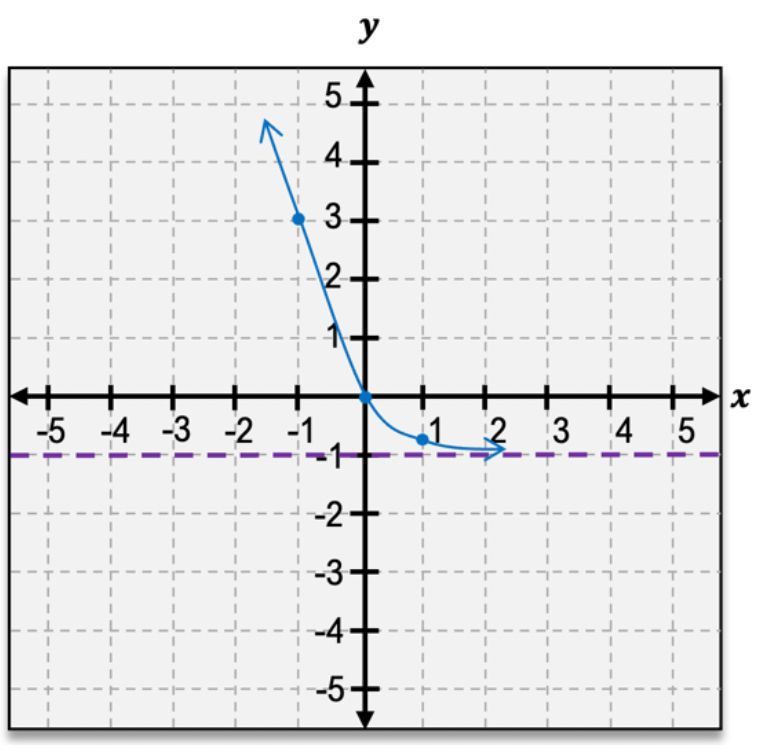
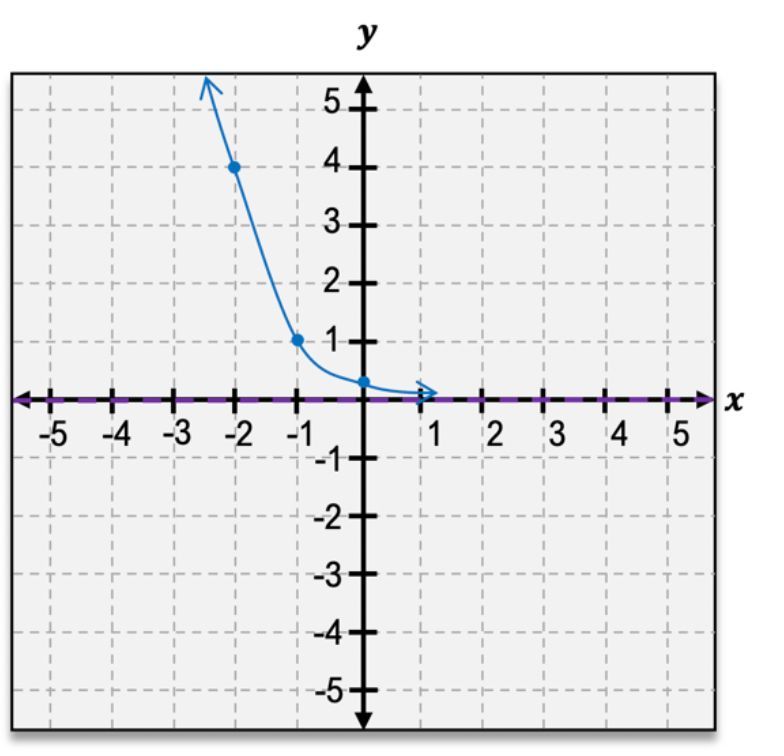
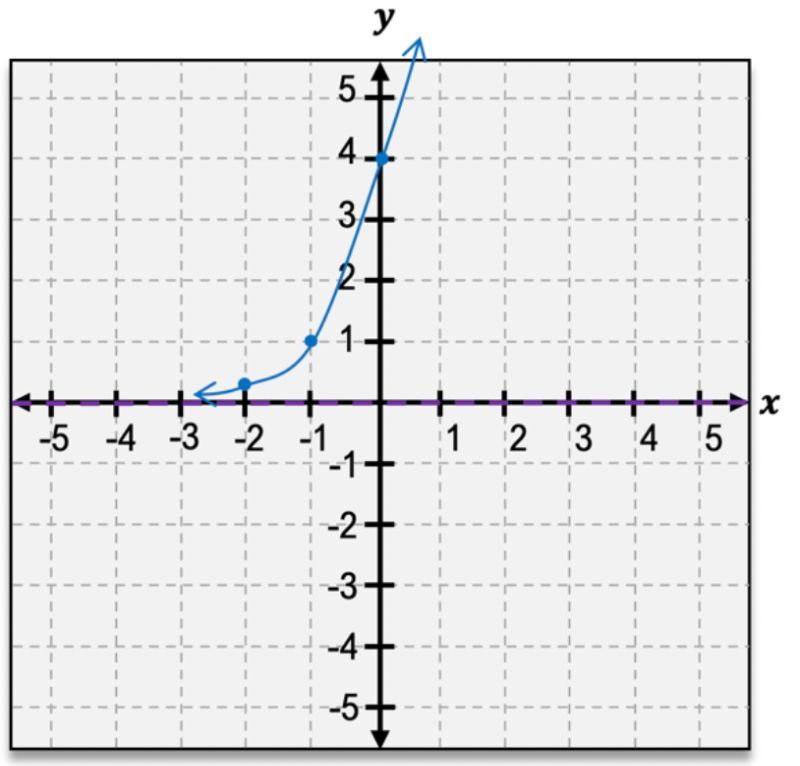
Identify the function type: The given function is an exponential function of the form g(x) = 4^{-x} - 1.
Determine the horizontal asymptote: For the function g(x) = 4^{-x} - 1, the horizontal asymptote is y = -1.
Find the y-intercept: Set x = 0 in the function to find the y-intercept. g(0) = 4^{0} - 1 = 1 - 1 = 0, so the y-intercept is (0, 0).
Analyze the behavior of the function: As x approaches positive infinity, 4^{-x} approaches 0, so g(x) approaches -1. As x approaches negative infinity, 4^{-x} becomes very large, so g(x) becomes very large.
Plot key points and asymptote: Plot the y-intercept (0, 0) and the horizontal asymptote y = -1. Sketch the curve starting from the y-intercept, approaching the asymptote as x increases, and rising steeply as x decreases.

 5:46m
5:46mWatch next
Master Graphs of Exponential Functions with a bite sized video explanation from Patrick
Start learning


