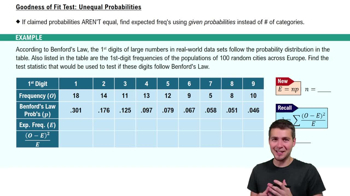
13. Chi-Square Tests & Goodness of Fit
Goodness of Fit Test
Struggling with Statistics for Business?
Join thousands of students who trust us to help them ace their exams!Watch the first videoMultiple Choice
A gym owner wants to know if the gym has similar numbers of members across different age groups. The table shows the distribution of ages for members from a random survey. Does this data set fit the criteria for a G.O.F. test?

A
Yes
B
No
C
More information is required.
 Verified step by step guidance
1
Step 1: Understand the problem. The gym owner wants to determine if the number of members is evenly distributed across different age groups. This requires a Goodness-of-Fit (G.O.F.) test, which compares observed frequencies to expected frequencies.
Step 2: Review the data provided. The table shows the age groups (18–25, 26–35, 36–45, 46–55, 56+) and the number of members in each group (54, 46, 53, 49, 48). These are the observed frequencies.
Step 3: Determine the criteria for a G.O.F. test. To perform a G.O.F. test, you need: (1) observed frequencies, (2) expected frequencies, and (3) a sufficiently large sample size (typically, all expected frequencies should be ≥ 5).
Step 4: Check if expected frequencies are provided or can be calculated. If the gym owner assumes equal distribution across age groups, the expected frequency for each group would be the total number of members divided by the number of age groups. If no assumption is made, more information is required to calculate expected frequencies.
Step 5: Conclude whether the data fits the criteria for a G.O.F. test. If expected frequencies are provided or can be calculated based on assumptions, and the sample size is sufficient, the data fits the criteria for a G.O.F. test. Otherwise, more information is required.

 1:17m
1:17mWatch next
Master Goodness of Fit Test with a bite sized video explanation from Patrick
Start learning