2. Describing Data with Tables and Graphs
Dot Plots
Struggling with Statistics for Business?
Join thousands of students who trust us to help them ace their exams!Watch the first videoMultiple Choice
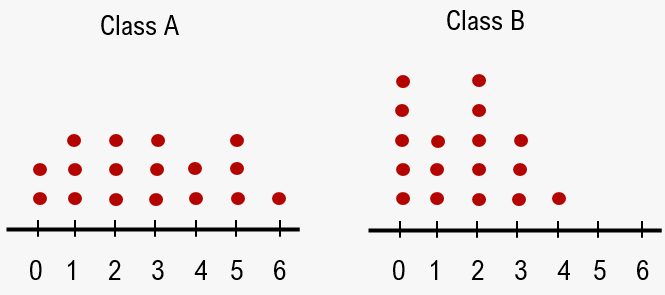
Compare the two dotplots, which give the number of siblings students have in Class A and Class B. Which class has more students with 2 siblings?
A
Class A
B
Class B
C
Both Class A and Class B
 Verified step by step guidance
1
Step 1: Observe the dotplots for Class A and Class B. Each dot represents one student, and the x-axis represents the number of siblings.
Step 2: Focus on the number '2' on the x-axis for both Class A and Class B. Count the number of dots above '2' in each plot.
Step 3: For Class A, count the dots above '2'. There are 4 dots, indicating 4 students with 2 siblings.
Step 4: For Class B, count the dots above '2'. There are 5 dots, indicating 5 students with 2 siblings.
Step 5: Compare the counts. Class B has more students with 2 siblings than Class A.


Related Videos
Related Practice

