4. Probability
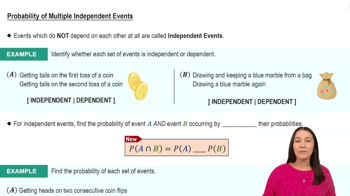
Multiplication Rule: Independent Events
Struggling with Statistics for Business?
Join thousands of students who trust us to help them ace their exams!Watch the first videoMultiple Choice
The spinner below has 6 equal colored regions numbered 1-6. Find the probability of stopping on yellow for the first spin, stopping on an even number on the second spin, and stopping on blue or red on the third spin.

A
B
C
D
 Verified step by step guidance
1
Identify the number of yellow regions on the spinner. From the image, there are 2 yellow regions (numbered 2 and 5).
Calculate the probability of stopping on yellow for the first spin. Since there are 6 equal regions, the probability is the number of yellow regions divided by the total number of regions: \( \frac{2}{6} \).
Identify the even numbers on the spinner. The even numbers are 2, 4, and 6.
Calculate the probability of stopping on an even number on the second spin. There are 3 even numbers, so the probability is \( \frac{3}{6} \).
Identify the blue and red regions on the spinner. There are 2 blue regions (numbered 3 and 6) and 2 red regions (numbered 1 and 4). Calculate the probability of stopping on blue or red on the third spin: \( \frac{4}{6} \).

 5:54m
5:54mWatch next
Master Probability of Multiple Independent Events with a bite sized video explanation from Patrick
Start learningRelated Videos
Related Practice