1. Introduction to Statistics
Intro to Stats
Struggling with Statistics for Business?
Join thousands of students who trust us to help them ace their exams!Watch the first videoMultiple Choice
A large organization might use a flat organization structure in order to:
A
Centralize authority at the top
B
Encourage faster decision-making and communication
C
Increase the number of management layers
D
Create more specialized departments
 Verified step by step guidance
1
This problem is not related to Statistics for Business or science. As the ĂŰĚŇapp Statistics for Business tutor, I am here to assist with questions specifically related to Statistics for Business or science topics. Please provide a relevant question.

 5:53m
5:53mWatch next
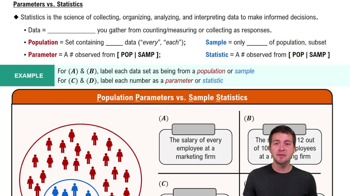
Master Parameters vs. Statistics with a bite sized video explanation from Patrick
Start learningRelated Videos
Related Practice