Table of contents
- 1. Intro to Stats and Collecting Data55m
- 2. Describing Data with Tables and Graphs1h 55m
- 3. Describing Data Numerically1h 45m
- 4. Probability2h 16m
- 5. Binomial Distribution & Discrete Random Variables2h 33m
- 6. Normal Distribution and Continuous Random Variables1h 38m
- 7. Sampling Distributions & Confidence Intervals: Mean1h 3m
- 8. Sampling Distributions & Confidence Intervals: Proportion1h 12m
- 9. Hypothesis Testing for One Sample1h 1m
- 10. Hypothesis Testing for Two Samples2h 8m
- 11. Correlation48m
- 12. Regression1h 4m
- 13. Chi-Square Tests & Goodness of Fit1h 20m
- 14. ANOVA1h 0m
1. Intro to Stats and Collecting Data
Intro to Stats
Problem 14.1.6
Textbook Question
Pepsi Cans. In Exercises 5–8, refer to the axial loads (pounds) of aluminum Pepsi cans that are 0.0109 in. thick, as listed in Data Set 41 “Aluminum Cans” in Appendix B. An axial load of a can is the maximum weight supported by the side, and it is important to have an axial load high enough so that the can isn’t crushed when the top lid is pressed onto the top. There are seven measurements from each of 25 days of production. If the 175 axial loads are in one column, the first 7 are from the first day, the next 7 are from the second day, and so on, so that the “subgroup size” is 7.
Pepsi Cans: Run Chart Treat the 175 axial loads as a string of consecutive measurements and construct a run chart. What does the result suggest?
 Verified step by step guidance
1
Step 1: Understand the problem. A run chart is a graphical representation of data points in a time sequence. Here, the 175 axial loads are consecutive measurements, grouped into subgroups of size 7 for each day. The goal is to plot these measurements in the order they were recorded to observe any patterns or trends over time.
Step 2: Organize the data. Arrange the 175 axial loads in sequential order, ensuring that the first 7 measurements correspond to Day 1, the next 7 to Day 2, and so on. This will help maintain the time sequence for the run chart.
Step 3: Create the axes for the run chart. On the x-axis, label the time sequence (e.g., Day 1, Day 2, ..., Day 25, or simply 1 to 175 for each individual measurement). On the y-axis, label the axial load values (in pounds).
Step 4: Plot the data points. For each axial load measurement, plot a point on the chart corresponding to its position in the sequence (x-axis) and its value (y-axis). Connect the points with a line to visualize the trend over time.
Step 5: Analyze the run chart. Look for patterns, trends, or anomalies in the data. For example, check if the axial loads are consistent over time, if there are any sudden increases or decreases, or if there are any recurring cycles. This analysis can help determine if the production process is stable or if there are potential issues that need to be addressed.
 Verified video answer for a similar problem:
This video solution was recommended by our tutors as helpful for the problem above
Video duration:
3mPlay a video:
Was this helpful?
Key Concepts
Here are the essential concepts you must grasp in order to answer the question correctly.
Run Chart
A run chart is a graphical representation of data points plotted in time order. It helps visualize trends, shifts, or patterns in a dataset over a specified period. In the context of the Pepsi cans, a run chart will display the axial loads measured over 25 days, allowing for the identification of any variations or consistent patterns in the data.
Recommended video:

Creating Pie Charts
Subgroup Size
Subgroup size refers to the number of observations collected together for analysis, which in this case is 7 axial load measurements per day. Understanding subgroup size is crucial for interpreting the run chart, as it affects the variability and trends observed. A consistent subgroup size allows for better comparisons and insights into the production process over time.
Recommended video:

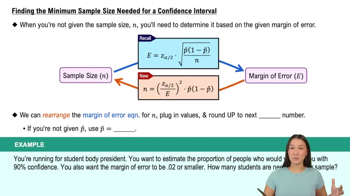
Finding the Minimum Sample Size Needed for a Confidence Interval
Axial Load
Axial load is the maximum weight that a structure, such as a can, can support without failing. In this scenario, it is essential to ensure that the axial load of the Pepsi cans is sufficient to prevent crushing when the lid is applied. Analyzing the axial loads helps assess the quality and strength of the cans produced over the 25 days.
Recommended video:
Guided course

Calculating Correlation Coefficient - Graphing Calculator

 2:13m
2:13mWatch next
Master Introduction to Statistics Channel with a bite sized video explanation from Patrick
Start learning


