6. Normal Distribution and Continuous Random Variables
Standard Normal Distribution
Problem 2.R.22
Textbook Question
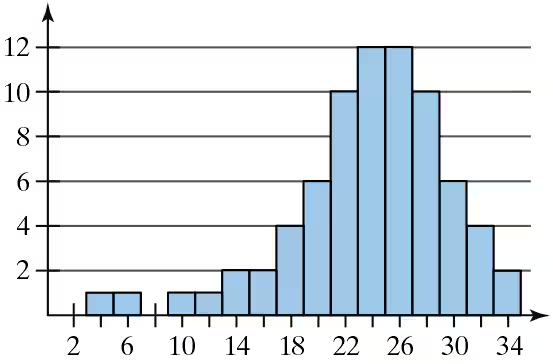
In Exercises 21 and 22, determine whether the approximate shape of the distribution in the histogram is symmetric, uniform, skewed left, skewed right, or none of these.
 Verified step by step guidance
1
Observe the histogram provided. Note the frequency of data points across the intervals on the x-axis and the height of the bars representing these frequencies.
Identify the general shape of the distribution. Look for patterns such as symmetry, peaks, or whether the data is concentrated more on one side.
Determine if the histogram is symmetric by checking if the left and right sides of the distribution are approximately mirror images of each other.
Check for skewness: If the tail of the distribution extends more to the left, it is skewed left. If the tail extends more to the right, it is skewed right.
If the histogram does not exhibit symmetry, skewness, or a uniform distribution, classify it as 'none of these.'
Verified video answer for a similar problem:This video solution was recommended by our tutors as helpful for the problem above
Video duration:
5mWas this helpful?
Key Concepts
Here are the essential concepts you must grasp in order to answer the question correctly.
Histogram
A histogram is a graphical representation of the distribution of numerical data, where the data is divided into intervals (bins) and the frequency of data points within each interval is represented by the height of the bars. It helps visualize the shape of the data distribution, making it easier to identify patterns such as central tendency, variability, and skewness.
Recommended video:
Guided course

 05:54
05:54Intro to Histograms
Distribution Shape
The shape of a distribution refers to the way data points are spread across the range of values. Common shapes include symmetric (equal on both sides), uniform (equal frequency across intervals), skewed left (tail on the left), and skewed right (tail on the right). Understanding the shape is crucial for interpreting data characteristics and making statistical inferences.
Recommended video:
 05:11
05:11Sampling Distribution of Sample Proportion
Skewness
Skewness measures the asymmetry of a distribution. A distribution is skewed left if it has a longer tail on the left side, indicating that most data points are concentrated on the right. Conversely, a skewed right distribution has a longer tail on the right side. Identifying skewness helps in understanding the underlying data trends and can influence the choice of statistical methods for analysis.
Recommended video:
 04:41
04:41Creating Frequency Polygons
 9:47m
9:47mWatch next
Master Finding Standard Normal Probabilities using z-Table with a bite sized video explanation from Patrick
Start learning

