3. Describing Data Numerically
Standard Deviation
Problem 2.R.34
Textbook Question
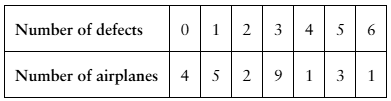
From a random sample of airplanes, the number of defects found in their fuselages are listed. Find the sample mean and the sample standard deviation of the data.
 Verified step by step guidance
1
Step 1: Organize the data into a frequency distribution table. The 'Number of defects' column represents the values (x), and the 'Number of airplanes' column represents the frequencies (f).
Step 2: Calculate the sample mean using the formula: . Multiply each defect value (x) by its frequency (f), sum these products, and divide by the total frequency.
Step 3: Calculate the sample variance using the formula: . Subtract the mean from each defect value (x), square the result, multiply by the frequency (f), sum these values, and divide by the total frequency minus 1.
Step 4: Calculate the sample standard deviation by taking the square root of the sample variance: .
Step 5: Interpret the results. The sample mean represents the average number of defects per airplane, and the sample standard deviation measures the variability of defects among the airplanes.
Verified video answer for a similar problem:This video solution was recommended by our tutors as helpful for the problem above
Video duration:
3mWas this helpful?

 8:45m
8:45mWatch next
Master Calculating Standard Deviation with a bite sized video explanation from Patrick
Start learningRelated Videos
Related Practice

